Hypothesis Testing and its Discontents, Part 3: What Can We Do?
Hypothesis testing is central to the way we do science, but it has major flaws that have encouraged widespread shoddy research. In part 1 of this series, we looked at the historical origins of hypothesis testing, and described two different approaches: Fisher’s significance testing, and Neyman-Pearson hypothesis testing. In part 2 we saw how modern researchers use hypothesis testing in practice. We looked at theoretical reasons the tools we use aren’t suited for many questions we want to ask, and also at the ways these tools encourage researchers to misuse them and draw dubious conclusions from questionable methods.
In this essay we’ll look at a number of methods that can help us draw better conclusions, and avoid the pitfalls of crappy hypothesis testing. We’ll start with some smaller and more conservative ideas, which basically involve doing hypothesis testing better. Then we’ll look at more radical changes, taking the focus away from hypothesis tests and seeing the other ways we can organize and contribute to scientific knowledge.
1. What was hypothesis testing, again?
But first, let’s remember what we’re talking about. The first two parts of this series answered two basic questions: how does hypothesis testing work, and how does it break?
In part 1, we learned about two major historical approaches to the idea of hypothesis testing: one by Fisher, and the other by Neyman and Pearson. Both start with a “null hypothesis”, which is usually an idea we’re trying to disprove. Then we collect some data, and analyze it under the assumption that the null hypothesis is true.
Fisher’s significance testing computes a \(p\)-value, which is the probability of seeing the experimental result you got if the null hypothesis is true. It is not the probability that the null hypothesis is false, but it does measure how much evidence your experiment provides against the null hypothesis. We say the result is significant if the \(p\)-value is below some pre-defined threshold, generally \(5\)%. If the null is actually false, we should be able to reliably produce these low \(p\)-values; Fisher wrote that a “scientific fact should be regarded as experimentally established only if a properly designed experiment rarely fails to give this level of significance”.
Neyman and Pearson didn’t worry about establishing facts; instead, they focused on making actionable, yes-or-no decisions. A Neyman-Pearson null hypothesis is generally that we should refuse to take some specific action, which may or may not be useful. We figure out how bad it would be to take the action if it is useless, and how much we’d miss out on if it’s useful, and use that to set a threshold; then we collect data and use our threshold to decide whether to act. This approach doesn’t tell us what to believe, just what to do. Sometimes we think that acting is probably useful, but that acting wrongly would be catastrophic so it would be wiser to do nothing. The Neyman-Pearson method takes that logic into account, and biases us towards inaction, making type I errors less common at the expense of making type II errors more common.1
Modern researchers use an awkward combination of these methods. Like Fisher, we want to discover true facts; but we use Neyman and Pearson’s technical approach of setting specific thresholds. We set a false positive threshold (usually \(5\)% and ideally a false negative threshold (we want it to be less than \(20\)%), and run our experiment. If we get a \(p\)-value less than the threshold —data that would be pretty weird if the null hypothesis is true, so weird it would only happen once every twenty experiments we run—then we “reject the null” and believe some alternative hypothesis. If our \(p\)-value is bigger, meaning our data wouldn’t look too weird if the null hypothesis is true, then we “fail to reject” the null and err on the side of believing the null hypothesis.
There are a few major problems with this setup.
-
Artificial decisiveness
The Neyman-Pearson method makes a definitive choice between two distinct courses of action. This reinforces a general tendency to force questions into yes-or-no binaries, even when that sort of clean dichotomy isn’t realistic or appropriate to the question. Hypothesis testing tells us whether something exists, but not really how common or how big it is.2
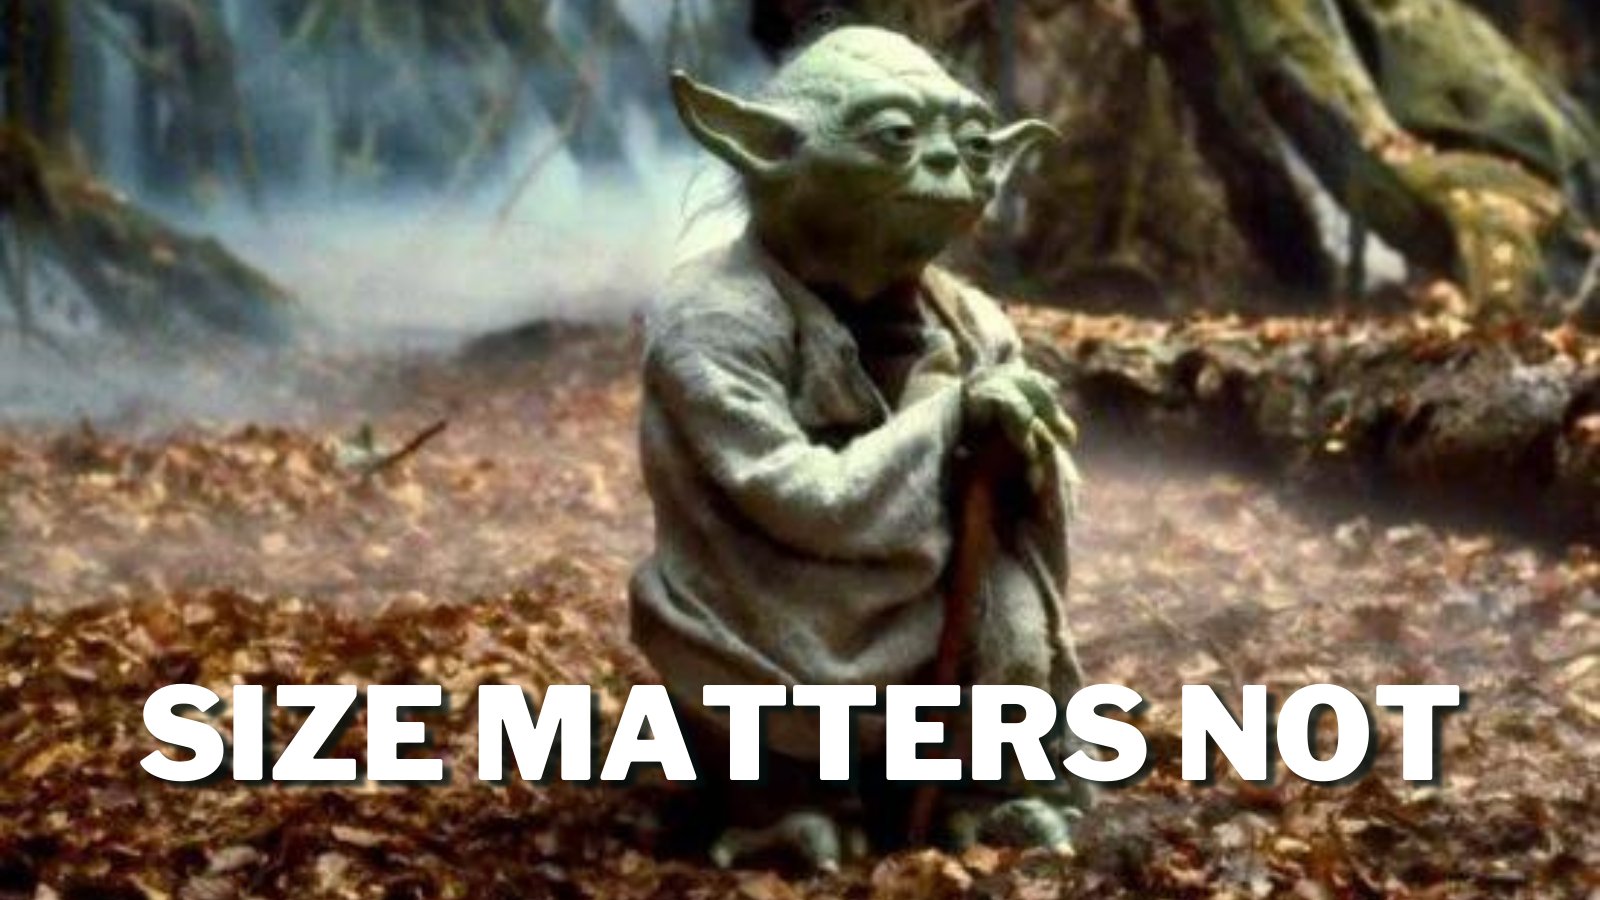 Unfortunately, Yoda is wrong. Sometimes we do care about size.
And more importantly, scientific knowledge is always provisional, so we need to continually revise our beliefs based on new information. But Neyman-Pearson is designed to make a final decision and close the book on the question, which just isn’t how science needs to work.
-
Bias towards the null
Neyman-Pearson creates a bias towards the null hypothesis, so rejecting the null feels like learning something new, while failing to reject is a default outcome. On one hand, this means it’s not a good tool if we want to show the null is true3. On the other hand, a study that fails to reject the null feels like a failed study, and that’s a huge problem if the null really is true! This can bias the studies we actually see since many non-rejections aren’t published. It doesn’t help us that most research is accurate if most published papers are not.
-
Motivated reasoning and \(p\)-hacking
Since researchers don’t want to fail, and do want to discover new things and get published, they have an incentive to find a way to reject the null.4 When done deliberately, we call this \(p\)-hacking, and there are a variety of questionable research practices that can help us wrongly and artificially reject a null hypothesis. Worse, the garden of forking paths means you can effectively \(p\)-hack without even knowing that you’re doing it, fudging both your theory and your data until they match.
-
Low power creates misleading results
At the same time, many studies have a low power, meaning they probably won’t reject the null even if it is actually false. Combined with publication bias, this can make the published literature unreliable: in some subfields, a majority of published results are untrue. And more, when underpowered studies do find something they tend to overestimate the effect, leading us to think everything works better than it actually does.
Despite all these problems, hypothesis testing is extremely useful—when we have a question it’s good for, and use it properly. So we’ll start by seeing how to make hypothesis testing work correctly, and some of the ways science has been shifting over the past couple decades to do a better job at significance testing.
2. Replication: Fisher’s principle
To create reliable knowledge we need to replicate our results; there will always randomly be some bad studies and replication is the only way to weed them out. (There’s a reason it’s the “replication crisis” and not the “some bad studies” crisis.) Any one study may produce weird data through bad luck; but if we can get a specific result consistently, then we’ve found something real.5
In some fields it’s common for important results to get replicated early and often. I’ve written before about how mathematicians are continuously replicating major papers by using their ideas in future work, and even just by reading them. Any field where research is iterative will generally have this same advantage.
In other fields replication is less automatic. Checking important results would take active effort, and often doesn’t happen at all. Complex experiments may be too expensive and specialized to replicate: the average phase \(3\) drug trial costs about \($20\) million, and even an exploratory phase 1 trial costs about \($4\) million. At those prices we’re almost forced to rely on one or two studies, and if we get unlucky with our first study it will be hard to correct our beliefs.6
But sometimes we just don’t treat replication work like it’s important. If we run a new version of an old study and get the same result, it can feel like a waste of time: we “knew that already”. Since our results are old news, it can be hard to get the work published or otherwise acknowledged. But if we run a new version of an old study and don’t get the same result, many researchers will assume our study must be flawed because they already “know” the first study was right. Replication can be a thankless task.
The replication crisis led many researchers to reconsider these priorities. Groups like the Many Labs Project and the Reproducibility Project: Psychology have engaged in large scale attempts to replicate famous results in psychology, which helped to clarify which “established” results we can actually trust. Devoting more attention to replication may mean we study fewer ideas and “discover” fewer things, but our knowledge will be much more reliable.7
Resistance to Replication
Unfortunately, replication work often gets a response somewhere between apathy and active hostility. Lots of researchers see “failed” replications as actual failures—the original study managed to reject the null, so why can’t you?
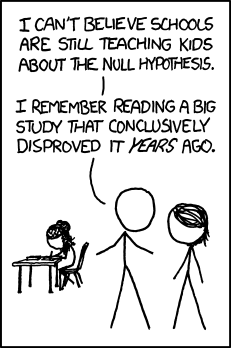 Alt text: “Hell, my eighth grade science class managed to conclusively reject it just based on a classroom experiment. It’s pretty sad to hear about million-dollar research teams who can’t even manage that.”
Worse, replications that don’t find the original result are often treated like attacks on both the original research and the original researchers. They “followed the rules” and got a publishable result, and now the “data police” are trying to take it away from them. At its worst, this leads to accusations of methodological terrorism. But even in less hostile discussions, people want to “save” the original result and explain away the failed replication—either by finding some specific subgroup in the replication where the original result seems to hold, or by finding some way the replication differs from the original study and so “doesn’t count”.8
This desire might seem weird, but it does follow pretty naturally from the Neyman-Pearson framework. The original goal of hypothesis testing is to make a decision and move on—even though that’s not how science should work. Replication re-opens questions that “were already answered”, which is good for science as a whole but frustrating to people who want to close the question and treat the result as proven.
Meta-analysis: use all the data
To make replication fit into a hypothesis testing framework, we often use meta-analysis, which synthesizes the data and results from multiple previous studies. Meta-analysis can be a powerful tool: why wouldn’t we want to use all the data out there, rather than picking just one study to believe? But it also allows us to move fully back into the Neyman-Pearson world. We can treat the whole collection of studies as one giant study, do one hypothesis test to it, and reach one conclusion.
Of course this leaves us with all the fundamental weaknesses of hypothesis testing: it tries to render a definitive yes-or-no answer, and it’s biased towards sticking with the null-hypothesis.
Moreover, a meta-analysis can only be as good as the studies that go into it. If those original studies are both representative and well-conducted, meta-analysis can produce a reliable conclusion. But if the component studies are sloppy and collect garbage data, as disturbingly many studies are, the meta-analysis will necessarily produce a garbage result. Good researchers try to screen out unusually bad studies, but if all the studies on some topic are bad then that won’t help.
And if not all studies get published, then any meta-analysis will be drawing on unrepresentative data. Imagine trying to estimate average human height, but the only data you have access to comes from studies of professional basketball players. No matter how careful we are, our estimates will be far too high, because our data all comes from unusually tall people. In the same way, if only unusually significant data gets published, even a perfect meta-analysis will be biased, because it can only use biased data.
Even if all studies get published, the garden of forking paths can bias the meta-analysis in exactly the same way, since each study may report an unusually favorable measurement. This is like if some studies report the height of their participants, and others the weight, and others the shoe size—but they all pick the measure that makes their subjects look biggest. Each study might report its data accurately, but we’d still end up with a misleading impression of how large people actually are.
Good meta-analyses will look for signs of selective publication, and there are statistical tools like funnel plots or \(p\)-curves, that can sometimes detect these biases in the literature. But these tools aren’t perfect, and of course they don’t tell us what we would have seen in the absence of publication bias. We can try to weed out bad studies after publication, but it’s better not to produce them in the first place.
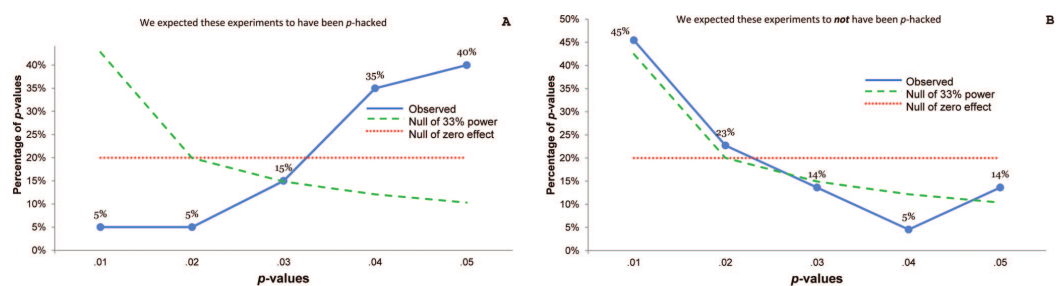 The \(p\)-curve: when there’s \(p\)-hacking or selection bias, we expect most significant studies to be just barely significant. When the effect is real, we expect small \(p\)-values to be much more common than large ones.
Figure from Simonsohn, Nelson, and Simmons.
The \(p\)-curve: when there’s \(p\)-hacking or selection bias, we expect most significant studies to be just barely significant. When the effect is real, we expect small \(p\)-values to be much more common than large ones.
Figure from Simonsohn, Nelson, and Simmons.
But of course, not all meta-analyses are good. Just like researchers have lots of ways to tweak their experiments to get statistical significance, doing a meta-analysis involves making a lot of choices about how to analyze the data, and so there are a lot of opportunities to \(p\)-hack or to get tricked by the garden of forking paths. Meta-analysis is like one giant hypothesis test, which means it can go wrong in exactly the same ways other hypothesis tests do.
3. Preregistration: do it right the first time
Hypothesis testing does have real weaknesses, but many of the real-world problems we deal with only happen when we do it wrong. The point of the Neyman-Pearson method to set out a threshold that determines whether we should act or not, collect data, and then see whether the data crosses the threshold. If we ignore the result when it doesn’t give the answer we want, then we’re not really using the Neyman-Pearson method at all.
But that’s exactly what happens in many common errors. When we ignore negative studies, we change the question from “yes or no” to “yes or try again later”. The garden of forking paths and \(p\)-hacking involve changing the threshold after you see your data. This makes it very easy for your data to clear the threshold, but not very informative.
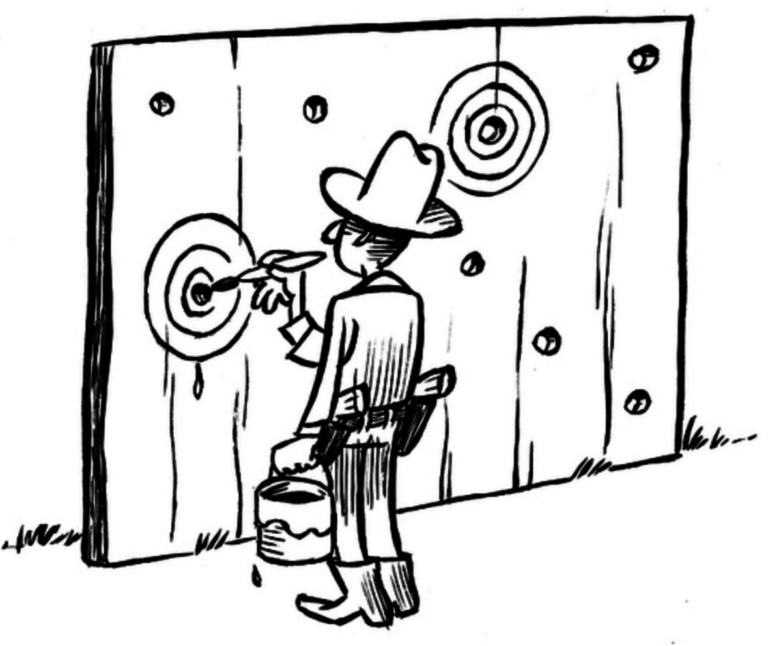 It’s easy to hit your target, if you pick the target after you shoot. But you don’t learn anything that way.
Illustration by Dirk-Jan Hoek, CC-BY
It’s easy to hit your target, if you pick the target after you shoot. But you don’t learn anything that way.
Illustration by Dirk-Jan Hoek, CC-BY
For hypothesis testing to work, we have to decide what would count as evidence for our theory before we collect the data. And then we have to actually follow through on that, even if the data tells us something we don’t want to hear.
Public registries
Following through with this is simple for private decisions, if not always easy. When I want to buy a new kitchen gadget, sometimes I’ll decide how much I’m willing to pay before I check the price. If it turns out to be cheaper than my threshold, I’ll buy it; if it’s more expensive, I won’t. This helps me avoid making dumb decisions like “oh, that fancy pasta roller set is on sale, so it must be a good deal”. I don’t need any fancy way to hold myself accountable, since there’s no one else involved for me to be accountable to. And of course, if the pasta roller is super expensive and I buy it anyway, I’m only hurting myself.
But science is a public, communal activity, and our decisions and behavior need to be transparent so that other researchers can trust and build on our results. Even if no one ever lied, it’s so easy for us to fool ourselves that we need some way to guarantee that we did it right—both to other scientists, and to ourselves. Everyone saying, “I swear I didn’t change my mind after the fact, honest!” just isn’t reliable enough.
To create trust and transparency, we can publicly preregister of our research procedures. If we publish our plans before conducting the study, everyone else can know we made our decisions before we ran the study, and they can check to see if the analysis we did matches the analysis we said we would do. When done well, this prevents p-hacking and protects us from the garden of forking paths, because we aren’t making any choices after we see the data.
Public preregistration also limits publication bias. Even if the study turns produces boring negative results, the preregistration plan is already published, so we know the study happened—it can’t get lost in a file drawer where no one knows about it. This preserves the powerful statistical protection of the Neyman-Pearson method: our false positive rate will be five percent, and no more.
Many journals have implemented registered reports, which allow researchers to submit their study designs for peer review, before they actually conduct the study. This means their work is evaluated based on the quality of the design and on whether the question is interesting; the publication won’t depend on what answer they find, which removes the selection bias towards only seeing positive results. Registered reports also restrict researchers to the analyses they had originally planned, rather than letting them fish around for an interesting result—or at least force them to explain why they changed their minds, so we can adjust for how much fishing they actually did.
The biggest concern about publication bias probably surrounds medical trials, where pharmaceutical companies have an incentive not to publish any work that would show their drugs don’t work. Many regulatory bodies including the FDA require clinical trials to be registered; the NIH also maintains a public database of trial registries and results. And this change had a dramatic impact in the results we saw from clinical trials.
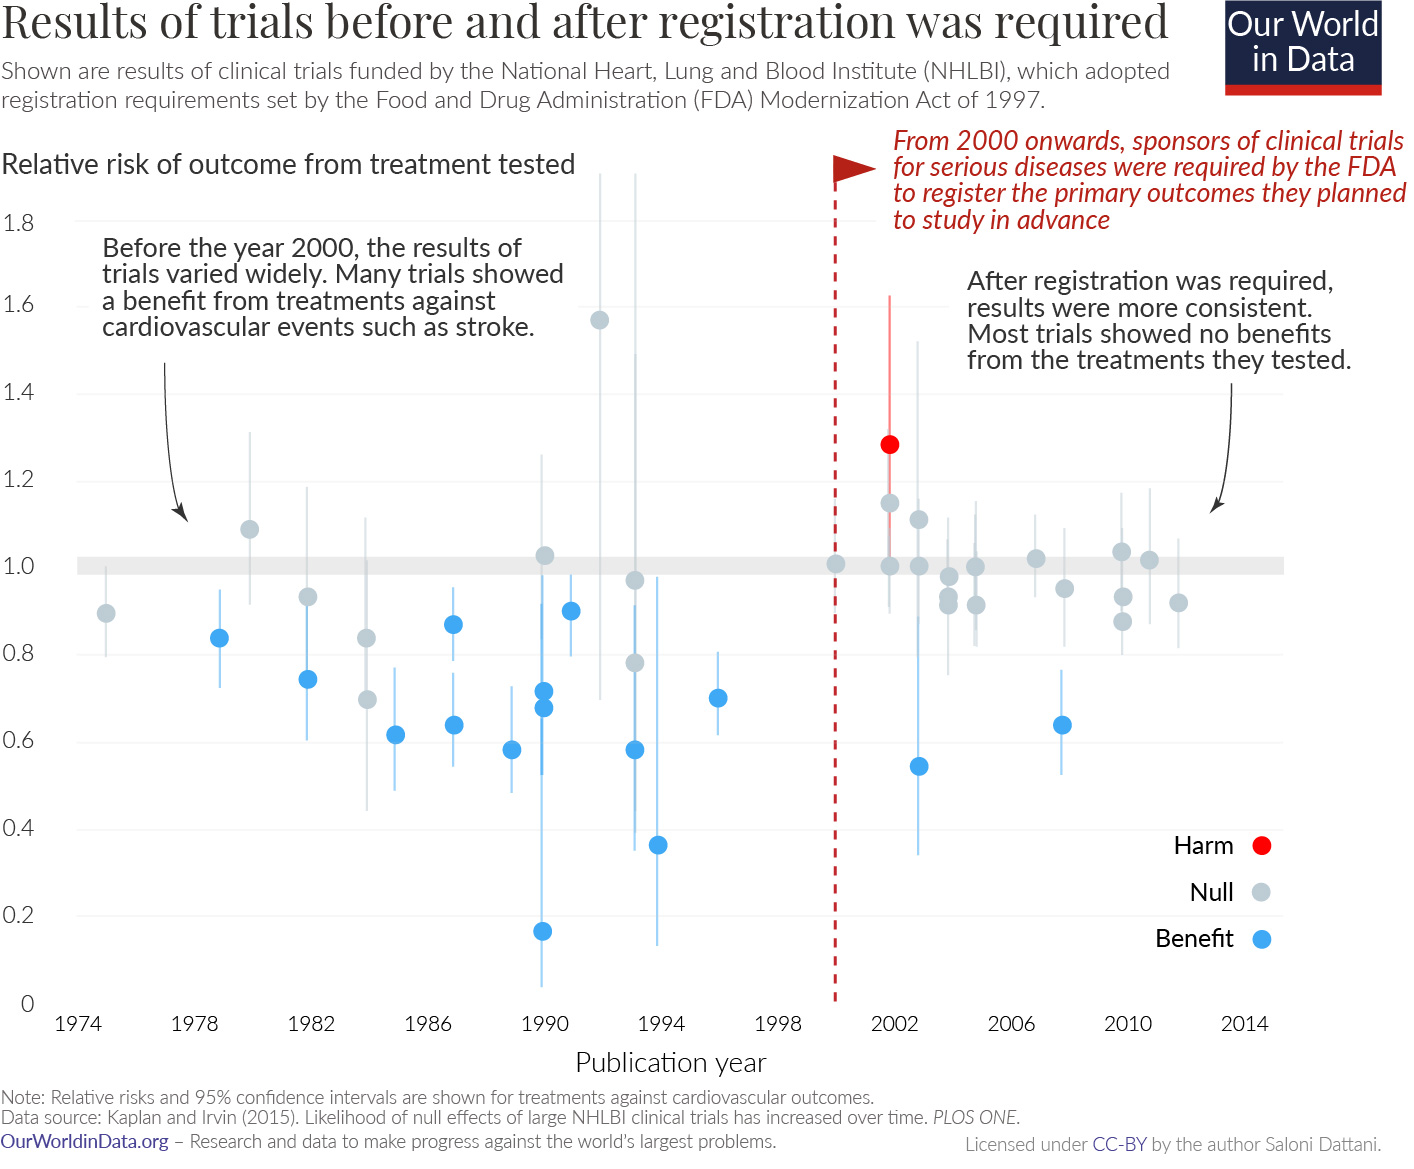 Before widespread preregistration, most trials showed large benefits. When we got more careful, these benefits evaporated.
Planning for power
Preregistration is also a great opportunity to plan out our study more carefully, and in particular to think about statistical power in advance. Remember the power of a study is the probability that it will reject the null hypothesis if the null is in fact false. We get more power when the study is better and more precise, but also when the effect we’re trying to measure is bigger and more visible: it’s pretty easy to show that cigarette smoking is linked to cancer, because the effect is so dramatic.9 But it’s much harder to detect the long-term effects of something like power posing, because the effects will be so small relative to other impacts on our personality.
On the other hand, if the effects are that small, maybe they don’t matter. If some economic policy reduces inflation by \(0.01\)%, then even if we could measure such a small reduction we wouldn’t really care—all we need to know is that the effect is “too small to matter”. With enough precision we could get statistical significance,10 but that doesn’t mean the result is practically or clinically significant. During the preregistration process we can decide what kind of effects would be practically important, and calibrate our studies to find those effects.
Planning for power also makes it easier to treat negative results as serious scientific contributions. The aphorism says that absence of evidence is not evidence of absence, but the aphorism is wrong. When a study has high power, we are very likely to see evidence if it exists; so absence of evidence becomes pretty good evidence of absence. If we know our studies have enough power, then our negative results become important and meaningful, and we won’t need to hide them in a file drawer.
A limited tool
And all of this is fantastic—but it doesn’t address many of the problems science actually presents us with. Modern hypothesis testing is optimized for taking a clear, well-designed question and giving a simple yes-or-no answer. That’s a good match for clinical trials, where the question is pretty much “should we use this drug or not?” By the time we’re in Phase 3 trials, we know what we think the drug will accomplish, and we can describe in advance a clean test of whether it will or not. Preregistration solves the implementation problems pretty thoroughly.
But preregistration does limit our ability to explore our data. This is necessary to make hypothesis testing work properly, but it’s still a cost. We really do want to learn new things from our data, not just confirm conjectures we’ve already made. Preregistration can’t help us if we don’t already have a hypothesis we want to test. And often, when we’re doing research, we don’t.
4. Bigger, Better Questions
Here are some scientific questions we might want to answer:
- What sorts of fundamental particles exist?
- What social factors contribute to crime rates?
- How does sleep deprivation affect learning?
- How effective is this cancer drug?
- How cost-effective is this public health program?
- How malleable are all the different steel alloys you can make?
None of these are yes-or-no questions. All of them are important parts of the scientific program, but none of them suggest specific hypotheses to run tests on. What do we do instead?
Spaghetti on the wall
Maybe the most obvious idea is just to test, well, everything.
 With apologies to Allie Brosh.
Now, we can’t test literally everything; collecting data takes time and money, and we can only conduct so many experiments. But we can take all the data we already have on crime rates, or on learning; and we can list every hypothesis we can think of and test them all for statistical significance. This data dredging is a very common, very bad idea, especially in the modern era of machine learning and big data. Mass testing like this takes all the problems of hypothesis testing—false positives, publication bias, low power, and biased estimates—and makes them much worse.
If we test every idea we can think of, most of them will be wrong. As we saw in part 2, that means a huge fraction of our positive results will be false positives. Sure, if we run all our tests perfectly, then only \(5\)% of our wrong ideas will give false positives. But since we have so many more bad ideas than good ones, we’ll still get way more false positives than true positives. (This is easiest to see in the case where all of our ideas are wrong—then all our positive results will be false positives!)
If we test just twenty different wrong ideas, there’s a roughly two-in-three chance that one of them will fall under the \(5\)% significance threshold, just by luck.11 That’s a lot higher than the false positive rate of \(5\)% that we asked for, and means we are very likely to “discover” something false. And then we’ll waste even more time and resources following up on our surprising new “discovery”.
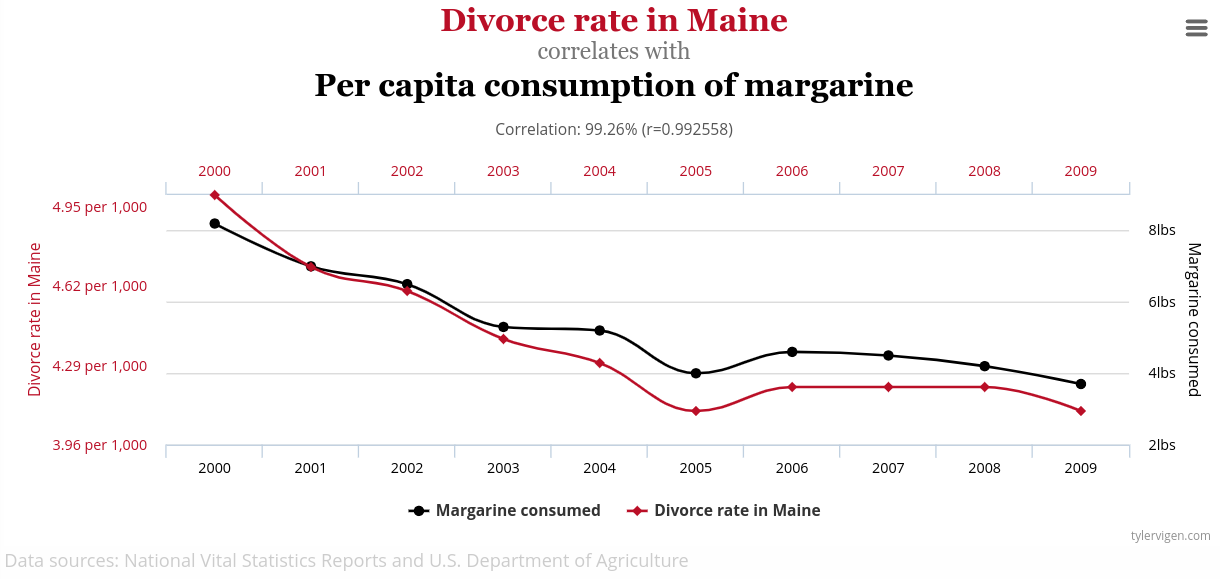 If you test everything, you’ll find a ton of spurious correlations like this one.
Multiple Comparisons
This multiple comparisons problem has a mathematical solution: we can adjust our significance threshold to bring our false positive rate back down. A rough rule of thumb is the Bonferroni correction, where we divide our significance threshold by the number of different ideas we’re testing. If we test twenty ideas but divide our \(5\)% significance threshold by twenty to get a corrected threshold of \(0.25\)%, then each individual result has a one-in-four-hundred chance of giving a false positive, but that gives us a roughly five percent chance of getting a false positive on one of those ideas.
The problem is sociological, not mathematical: people don’t like correcting for multiple comparisons, because it makes it harder to reach statistical significance and “win” the science game. Less cynically, correcting for multiple comparisons reduces the power of our studies dramatically, making it harder to discover real and important results. Ken Rothman’s 1990 paper No Adjustments Are Needed for Multiple Comparisons articulates both of these arguments admirably clearly: “scientists should not be so reluctant to explore leads that may turn out to be wrong that they penalize themselves by missing possibly important findings.”
Rothman is right in two important ways. First, researchers should not be penalized for conducting studies that don’t reach statistical significance. Studies that fail to reject the null, or measure a tiny effect, are valuable contributions to our store of knowledge. We tend to overlook and devalue these null results, but that’s a mistake, and one of the major benefits of preregistration is protecting and rewarding them.
Second, it’s important to investigate potential leads that might not pan out. As Isaac Asimov may or may not have said, “The most exciting phrase in science is not ‘Eureka!’ but ‘That’s funny…’”; and it’s important to follow up on those unexpected, funny-looking results. After all, we have to find hypotheses somewhere.
But undirected exploration is, very specifically, not hypothesis testing. Rothman suggests that we often want to “earmark for further investigation” these unexpected findings. But hypothesis testing isn’t designed to flag ideas for future study; instead a hypothesis test concludes the study, with (in theory) a definitive answer. Rothman’s goals are correct and important, but hypothesis testing and statistical significance aren’t the right tools for those goals.12
Jumping to conclusions
At some point, though, we do generate some hypotheses.13 If we’re studying how memory interacts with speech, we might hypothesize that describing a face verbally will make you worse at recognizing it later, which gives us something concrete to test. Or, more tenuously, if we’re studying the ways that sexism affects decision-making, we might hypothesize that hurricanes with feminine names are more deadly because people don’t take them as seriously.
And then we can test these hypotheses, and reject the null or not, and then—what? What does that tell us?
We have a problem, because these hypotheses aren’t the questions we really want to answer. If installing air filters in classrooms increases measured learning outcomes, that’s a fairly direct answer to the question of whether installing air filters in classrooms can help children learn, so a hypothesis test really can answer our question. But we shouldn’t decide that sexism is fake just because feminine names probably don’t make hurricanes deadlier!14 We should only care about the hurricane-names thing if we think it tells us something about our actual, real-world concerns.
And that means we can’t just test one random hypothesis relating to our big theoretical question and call it a day. We need to develop hypotheses that are reasonably connected to the questions we care about, and we need to approach those questions from many different perspectives to make sure we’re not missing anything. That means there’s a ton of work other than hypothesis testing that we need to do if we want our hypothesis tests to tell us anything useful:15
- Defining terms: First we need to decide what question we’re actually trying to answer! There are a lot of different things people mean by “sexism” or “memory” or “crime”, and our research will be confused unless we make sure we’re consistently talking about the same thing.16
- Causal modeling: What sort of relationships do we expect to see? If our theory on the Big Question is true, what experimental results does that imply? What other factors could confound or interfere with these effects? We need to know what relationships we’re looking for before we can design tests for them.
- Developing measurements: How will we measure the inputs and outputs to our theory? What numbers will we use to measure crime levels, or educational improvement, or ability to remember faces? Are the things we’re measuring closely connected to the definitions we chose earlier? It’s easy to measure something but hard to make sure the measurement tells us what we want to know.
- Determining scope: When do we expect our theory to work, and for what sort of extreme results do we expect it to break down? What experiments should we not bother running? It’s worth studying whether mild air pollution makes learning harder, without worrying about the major health effects that we know severe pollution causes.
- Auxiliary assumptions: What extra assumptions are we making in all the previous steps, and how can we verify them? Does installing classroom air filters actually reduce pollution? Do people who verbally described a face try equally hard at the later recall task? How can we tell? We can’t avoid making assumptions, but we can try to be explicit about them, and check the ones that could cause problems.
Without all this work, we can come up with hypotheses, but they won’t make sense. We can run experiments, but we can’t interpret them. And we can do hypothesis tests, but we can’t use them to answer big questions.
5. Failing to measure up
And sometimes we have a direct question that presents a clear experiment to run, but not a clear hypothesis. Questions like “How effective is this cancer drug?” or “how malleable is this steel alloy?” aren’t big theoretical questions, but also aren’t specific hypotheses that can be right or wrong. We want numbers.
In practice we often use hypothesis testing to answer these questions anyway—but with an awkward kludge. We can test a null hypothesis like “this public health program doesn’t save lives”. If we fail to reject the null, we conclude that it doesn’t help at all; if we do reject the null, we see how many lives the program saved in our experiment, and use that as an estimate of its effectiveness.
This works well enough that we kinda get away with it, but it introduces consequential biases into our measurements. If the measured effect is small, we round it down to zero, concluding there is no benefit when there may well be a small but real benefit (or a small but real harm). And if significant studies are more likely to be seen than non-significant studies, we will see more unusually good results than unusually bad ones, which means we will believe basically everything is more effective than it actually is.17
We shouldn’t be surprised that hypothesis testing does a bad job of measuring things, because hypothesis testing isn’t designed to measure things. It’s specifically designed to not report a measurement, and just tell us whether we should act or not. It’s the wrong tool for this job.
We can and should do better. A study in which mortality decreases by \(0.1\)% is evidence that the program works—possibly weak evidence, but still evidence! And if we skip the hypothesis testing and put measurement first, we can represent that fact accurately.
Compatibility checking
The simplest thing to do would be to just average all our measurements and report that number. This is a type of point estimate, the single number that most accurately reflects our best guess at the true value of whatever we’re measuring.
But a point estimate by itself doesn’t give as much information as we need. We need to measure our uncertainty around that estimate, and describe how how confident we are in it. A drug that definitely makes you a bit healthier is very different from one that could save your life and could kill you, and it’s important to be clear which one we’re talking about.
We can supplement our point estimate with a confidence interval, also called a compatibility interval, which is sort of like a backwards hypothesis test. We give all the values that are compatible with our measurement—values that would make our estimate relatively unsurprising. Rather than starting with a single null hypothesis and checking whether our measurement is compatible with it, we start with the measurement, and describe all the hypotheses that would be compatible.
The definition is a bit more technical, and easy to get slightly wrong: If we run \(100\) experiments, and generate a \(95\)% confidence interval for each experiment, then the true value will lie in about \(95\) of those intervals. A common mistake is to say that if we generate one confidence interval, the true value has a \(95\)% chance of landing in it, but that’s backwards, and not quite right.18 But before we run the experiment, we expect a \(95\%\) chance that the true value will be in the confidence interval we compute.
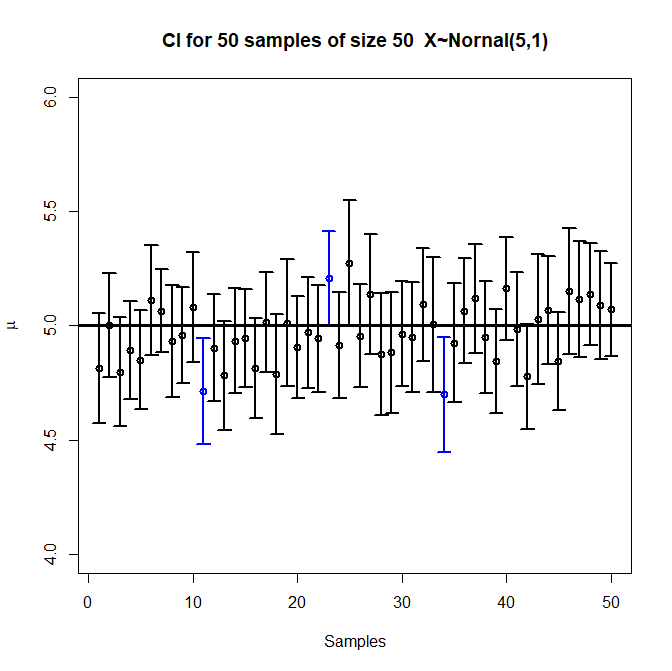 Each vertical bar is a compatibility interval from one experiment, with a circle at the point estimate. Three of the intervals don’t include the true value, which is roughly \(5\)% of the \(50\) intervals.
Image by Randy.l.goodrich, CC BY-SA 4.0
Each vertical bar is a compatibility interval from one experiment, with a circle at the point estimate. Three of the intervals don’t include the true value, which is roughly \(5\)% of the \(50\) intervals.
Image by Randy.l.goodrich, CC BY-SA 4.0
Mathematically, these intervals are closely related to hypothesis tests. A result is statistically significant if the null hypothesis (often \(0\)) lies outside the compatibility interval. So in a sense compatibility intervals are just giving the same information as a hypothesis test, just in a different format. But changing the format shifts the emphasis of our work, and the way we think about it. Rather than starting by picking a specific claim and then saying yes or no, we give a number, and talk about what theories and models are compatible with it. This avoids needing to pick a specific hypothesis. It also gives our readers more information, rather than compressing our answer into a simple binary.
Focusing on compatibility intervals can also help avoid publication bias, and make it easier to use all the data that’s been collected. When we report measurements and compatibility intervals, we can’t “fail to reject” a null hypothesis. Every study will succeed at producing an estimate, and a compatibility interval, so every study produces knowledge we can use, and no study will “fail” and be hidden in a file drawer. Some studies might be designed and run better than others, and so give more precise estimates and narrower compatibility intervals. We can give more weight to these studies when forming an opinion. But we won’t discard a study just for yielding an answer we didn’t expect.
6. Bayesian statistics: the other path
Throughout this series, we’ve used the language and perspective of frequentist statistics. This is the older and more classical approach to statistics, which defines probability in terms of repeated procedures. “If we test a true null hypothesis a hundred times, we’ll only reject it about five times”. “If we run this sampling procedure a hundred times, the compatibility interval will include the true value about \(95\) times.” This approach to probability is philosophically straightforward, and leads to relatively simple calculations.
But there are questions it absolutely can’t answer—like “what is the probability my null hypothesis is true?”—since we can’t frame them in terms of repeated trials. Remember, the \(p\)-value is not the probability the null is false. Its definition is a complicated conditional hypothetical that’s hard to state clearly in English: it’s the probability that we would observe what we actually did observe under the assumption that the null hypothesis is true. This is easy to compute, but it’s difficult to understand what it means (which is why I wrote like six thousand words trying to explain it).
But there’s another school of statistics that can produce answers to those questions. Bayesian inference, which I’ve written about before, lets us assign probabilities to pretty much any statement we can come up with. This is great, because it can directly answer almost any question we actually have. But it’s also much, much harder to use, because it requires much more data and more computation. And the bigger and more abstract the question we ask, the worse this gets.
Bayesian inference needs three distinct pieces of information:
- The probability of seeing our data, assuming the hypothesis is true, which is just the \(p\)-value we’ve been discussing;
- The probability of seeing our data, assuming the hypothesis is false, which is another \(p\)-value; and
- The prior probability that our hypothesis is true, based on the evidence we had before we run the experiment.
Then we run an experiment, collect data, and use a formula called Bayes’s theorem to produce a posterior probability, our final estimate of the likelihood our hypothesis is true.19
That’s a lot more complicated! First of all, we have to compute two \(p\)-values, not just one. But second, we calculate the extra \(p\)-value under the assumption that “our hypothesis is false”, and that covers a lot of ground. If our hypothesis is that some drug prevents cancer deaths, then the alternative includes “the drug does nothing”, “the drug increases cancer deaths”, “the drug prevents some deaths and causes others”, and even silly stuff like “aliens are secretly interfering with our experiments”. To do the Bayesian calculation we need list every possible way our hypothesis could be false, and compute how likely each of those ways is and how plausible each one makes our data. That gets very complicated very quickly.
(In contrast, Fisher’s approach starts by assuming the null hypothesis is true, and ignores every other possibility. This makes the calculation much easier to actually do, but it also limits how much we can actually conclude. High \(p\)-value? Nothing weird. Low \(p\)-value? Something is weird. But that’s all we learn.)
And third, even if we can do all those calculations somehow, we need that prior probability. We want to figure out how likely it is that a drug prevents cancer. And as the first step, we have to plug in…the probability that the drug prevents cancer. We don’t know that! That’s what we’re trying to compute!
Bayesian machinery is great for refining and updating numbers we already have. And the more data we collect, the less the prior probability matters; we’ll eventually wind up in the correct place. So in practice, we just pick a prior that’s easy to compute with, plug it into Bayes’s theorem, and try to collect enough data that we expect our answer to be basically right.
And that brings us back to where we began, with replication. The more experiments we run, the more we can learn.
7. Conclusion: (Good) data is king
I closed out part 2 with an xkcd statistics tip: “always try to get data that’s good enough that you don’t need to do statistics on it.” Here at the end of part 3, we find ourselves in exactly the same place. But this time, I hope you see that tip, not as a punchline, but as actionable advice.
Modern hypothesis testing “works”, statistically, as long as you ask exactly the questions it answers, and are extremely careful in how you use it. But we often misuse it by collecting flawed or inadequate data and then drawing strong, sweeping conclusions. We run small studies and then \(p\)-hack our results into significance, rather than running the careful, expensive studies that would genuinely justify our theoretical claims. We report the results as over-simplified yes-or-no answers rather than trying to communicate the complicated, messy things we observed. And if we manage to reject the null on one study we issue press releases claiming it confirms all our grand theories about society.
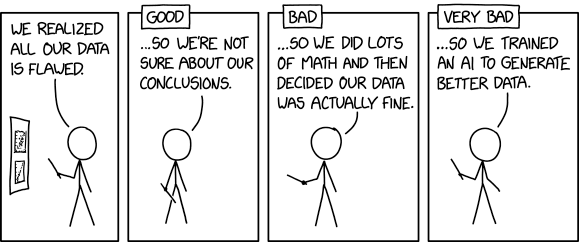 Too often, we use statistics to help us pretend bad data is actually good.
In this essay we’ve seen a number of possible solutions, but they’re basically all versions of “collect more and better data”:
- Do enough foundational work that you can formulate good hypotheses, and figure out what data you need to draw usable conclusions.
- If you have numerical data, use the numbers, rather than throwing away information and just giving a single yes or no.
- Preregister your studies, to make sure your data is useful and you’re not altering it to fit your conclusions.
- Replicate your studies, so you collect more data that can either confirm or correct your beliefs.
Even the Bayesian approach comes back to this. Bayesianism relies on the prior probability; but that really just means that, if we already have some knowledge before we run the experiment, we should use it!
Statistics is powerful and useful. We couldn’t do good science without it. But data—empirical observation—is the core of science. Statistics helps us understand the data we have, and it helps us figure out what data we need. But if our data sucks, statistics alone cannot save us.
Have questions about hypothesis testing? Is there something I didn’t cover, or even got completely wrong? Do you have a great idea for doing science better? Tweet me @ProfJayDaigle or leave a comment below.
-
We could reverse this, and err on the side of acting, if we think wrongly doing nothing has worse downsides than wrongly acting. But it’s pretty uncommon to do it that way in practice. ↵Return to Post
-
We’ve seen the effects of this unnecessary dichotomization over and over again during the pandemic. We argued about whether masks “work” or “don’t work”, rather than discussing how well different types of masks work and how we could make them better. I know people who are still extremely careful to wear masks everywhere, but who wear cloth masks rather than medical—a combination that makes very little sense outside of this false binary.) ↵Return to Post
-
There are variants of hypothesis testing that help you show some null hypothesis is (probably) basically right. But they’re not nearly as common as the more standard setup. ↵Return to Post
-
Nosek, Spies, and Motyl write about the experience of carefully replicating some interesting work before publication, and seeing the effect vanish: "Incentives for surprising, innovative results are strong in science. Science thrives by challenging prevailing assumptions and generating novel ideas and evidence that push the field in new directions. We cannot expect to eliminate the disappointment that we felt by “losing” an exciting result. That is not the problem, or at least not one for which the fix would improve scientific progress. The real problem is that the incentives for publishable results can be at odds with the incentives for accurate results. This produces a conflict of interest….The solution requires making incentives for getting it right competitive with the incentives for getting it published." ↵Return to Post
-
The result we’ve found doesn’t necessarily mean what we think it means, and that is its own tricky problem. But if you get a consistent effect then you’ve found something even if you don’t understand it yet. ↵Return to Post
-
If a drug is wrongly approved, we continue learning about it through observation of the patients taking it. This is, for instance, how we can be quite certain that the covid vaccines are effective and extremely safe. But if we don’t approve a drug, there’s no followup data to analyze, and the drug stays unapproved. ↵Return to Post
-
My favorite suggestion comes from Daniel Quintana, who wants undergraduate psychology majors to contribute to replication efforts for their senior thesis research. Undergraduate research is often more about developing methodological skill than about producing genuinely innovative work, so it’s a good fit for careful replication of already-designed studies. ↵Return to Post
-
You might wonder if a result that depends heavily on minor differences in study technique can actually be telling us anything important. That’s a very good question. It’s very easy to run a hypothesis test that basically can’t tell us anything interesting; we’ll come back to this later in the piece. ↵Return to Post
-
Somewhat infamously, Fisher stubbornly resisted the claim that smoking caused cancer until his death. But he never denied the correlation, which was too dramatic to hide. ↵Return to Post
-
As long as two factors have any relationship at all, the effect won’t be exactly zero, and with enough data we’ll be able to reject the null hypothesis that there’s no effect. But that just means “is the effect exactly zero” is often the wrong question; instead we want to know if the effect is big enough to matter. ↵Return to Post
-
The odds of getting no false positives after \(n\) trials is \(0.95^n\), so the odds of getting a false positive are \(1 - 0.95^n\). And \(0.95^{20} \approx 0.358\), so \(1 - 0.95^{20} \approx 0.652\).
It’s a little surprising this is so close to \(2/3\), but there’s a reason for it—sort of. If you compute \( (1- 1/n)^n\) you will get approximately \(1/e\), so the odds of getting a false positive at a \(1/20\) false positive threshold after \(20\) trials are roughly \(1-1/e \approx .63\). ↵Return to Post
-
From what I can tell, Rothman may well agree with me. His twitter feed features arguments against using statistical significance and dichotomized hypotheses in place of estimation, which is roughly the position I’m advocating. But if you’re doing hypothesis testing, you should try to do it correctly. ↵Return to Post
-
You might notice that I’m not really saying anything about where we find these hypotheses. There’s a good reason for that. Finding hypotheses is hard! It’s also the most creative and unstructured part of the scientific process. The question is important, but I don’t have a good answer. ↵Return to Post
-
For that matter, if feminine hurricane names were less dangerous we could easily tell a story about how that was evidence for sexism. That’s the garden of forking paths popping up again, where many different results could be evidence for our theory. ↵Return to Post
-
In their wonderfully named (and very readable) paper Why hypothesis testers should spend less time testing hypotheses, Anne Scheel, Leonid Tiokhin, Peder Isager, and Daniël Lakens call this the derivation chain: the empirical and conceptual linkages that allow you to derive broad theoretical claims from the specific hypotheses you test. ↵Return to Post
-
This is one of the major skills you develop in math courses, because a lot of the work of math is figuring out what question you’re trying to answer. I’ve written about this before, but I also recommend Keith Devlin’s excellent post on what “mathematical thinking” is, especially the story he tells after the long blockquote. ↵Return to Post
-
We also sometimes find that our conclusions depend on exactly which questions we ask. Imagine a study where we need a \(5\)% difference to be significant, and Drug A produces a \(3\)% improvement over placebo and Drug B produces a \(7\)% improvement. Then the effect of Drug A isn’t significant, and the effect of Drug B is, so we say that Drug A doesn’t work and Drug B does.
But the difference between Drug A and Drug B is not significant—so if we ask that question, we conclude that the two drugs are equally good! The difference between "significant" and "not significant" is not itself statistically significant, so it matters exactly which hypothesis we choose to test. ↵Return to Post
-
Sometimes we can look at our interval after the fact and make an informed guess whether it’s one of the good intervals or the bad intervals. If I run a small study to measure average adult heights, there’s some risk I get a \(95\)% confidence interval that contains, say, everything between five feet and six feet. Based on outside knowledge, I’m pretty much \(100\)% confident in that interval, not just \(95\)%. ↵Return to Post
-
We saw examples of this calculation in part 2, when we calculated what fraction of positive results were true positives. Note that we had to make assumptions about what fraction of null hypotheses are true; that’s the Bayesian prior probability. Tables like the ones we used there show up a lot in simple Bayesian calculations. ↵Return to Post
Tags: philosophy of math science replication crisis statistics bayes